


How to Monitor Solar Panel Performance: 7 Warning Signs
Most solar owners rely on basic monitoring apps that show production numbers but miss critical performance issues. This guide reveals the 7 key indicators every Southern California homeowner should track, common problems that go undetected for months, and when DIY monitoring isn't enough. Learn how to validate actual savings and protect your solar investment.
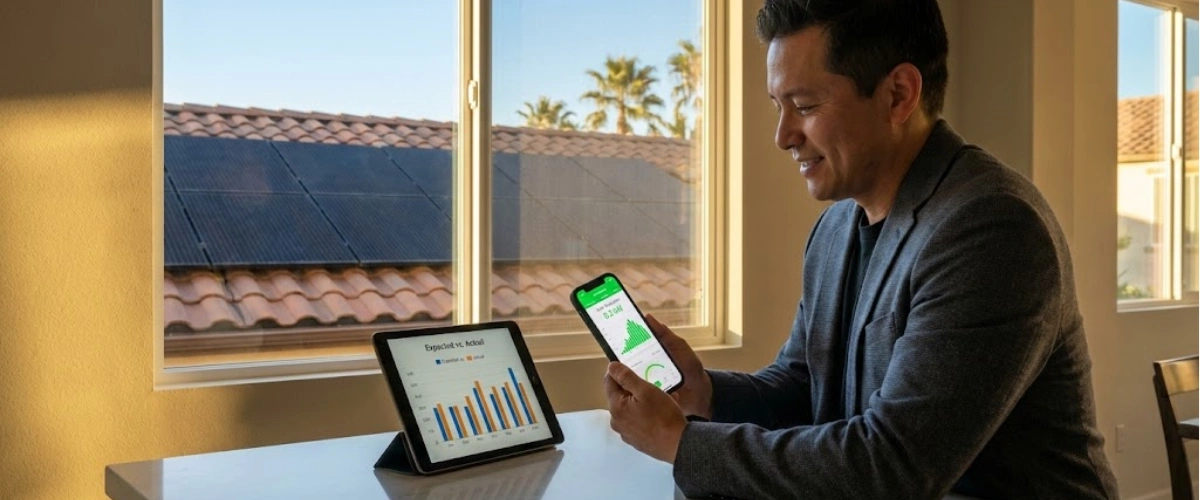
You check your solar app, see those green bars climbing, and assume everything's working perfectly. But what if your system has been underperforming for months—and you never knew?
A recent discussion among solar owners revealed a troubling pattern: people don't discover system failures until 30-60% of their panels stop working. One church went months with a third of their system offline before anyone noticed.
The problem isn't the technology—it's that basic monitoring apps weren't designed to catch performance issues. They show you production data, but they don't tell you if that production is actually normal for your system.
This guide will show you the 7 critical performance indicators every Southern California solar owner should track, how to spot problems before they cost you thousands, and when professional assessment becomes necessary.
Why Basic Solar Apps Fall Short for Performance Monitoring
Most inverter apps from Enphase, SolarEdge, or SMA show real-time production and historical data. They're excellent for tracking how much energy you're generating—but they have critical blind spots.
These manufacturer apps don't compare your actual production against expected performance for your specific system. They can't tell you if sunny days should produce 45 kWh instead of the 32 kWh you're seeing.
Solar owners using multiple data sources—inverter apps, utility portals, and home energy monitors—often find themselves asking the same question: "Is this normal?" The data exists, but the interpretation doesn't.
This is why many solar owners only discover issues during their annual maintenance check, or worse, when reviewing their utility bills months later and realizing the savings never materialized. By then, you've lost hundreds or thousands of dollars in electricity costs.
What you need are solar monitoring tools that go beyond basic production graphs and actually alert you to performance anomalies.
Understanding Solar Performance Metrics Every Homeowner Should Know
Before you can monitor performance, you need to understand what "normal" looks like for your system. Here are the fundamental metrics that matter.
Daily Production Patterns
Your system should follow a predictable curve throughout the day. Production starts low at sunrise, peaks around solar noon (typically 11 AM-1 PM in Southern California), then tapers off toward sunset.
If your production curve looks choppy, flat during peak hours, or cuts out unexpectedly, something's wrong. These patterns often indicate shading issues, inverter problems, or panel degradation.
Seasonal Variation Baselines
Summer production can be 30-40% higher than winter production in Southern California—this is completely normal. The sun is higher in the sky, days are longer, and there's less cloud cover.
What's not normal: dramatic drops in production during typically high-performing months (April-September), or inconsistent output from day to day under similar weather conditions.
Understanding these solar glossary terms helps you interpret what your monitoring data is actually telling you.
Weather-Adjusted Expectations
Cloudy days will reduce production by 10-25%, but your system should still generate power. Complete drops to zero production on overcast days often signal equipment failure, not weather.
Marine layer is common along the coast, particularly in June ("June Gloom"). This can reduce morning production by 40-50% until it burns off, which is expected behavior.
7 Performance Indicators Every Solar Owner Should Track
These seven indicators will help you catch problems before they become expensive failures.
1. Production Consistency Day-to-Day
Compare production on similar weather days. If last Tuesday generated 42 kWh and this Tuesday (same conditions) only produced 34 kWh, investigate immediately.
Most inverter apps let you view daily production history. Look for unexplained drops of 15% or more compared to previous weeks under similar conditions.
2. Panel-Level Performance (For Microinverter Systems)
If you have Enphase microinverters or SolarEdge optimizers, you can see individual panel production. One underperforming panel might indicate shading, soiling, or a failing microinverter.
Watch for panels consistently producing 20%+ less than their neighbors. This rarely fixes itself and usually worsens over time.
3. Inverter Alerts and Error Codes
Your inverter is the brain of your solar system. Most modern inverters report error codes through their monitoring app or display panel.
Don't ignore these warnings. Common errors like "AC voltage too high" or "grid frequency out of range" can indicate serious electrical issues that prevent your system from feeding power to your home.
If you're experiencing inverter problems, understanding predictive failure alerts can help you address issues before complete failure.
4. String Performance (For String Inverter Systems)
String inverters connect multiple panels in series. If one panel fails or becomes heavily shaded, it can drag down the entire string's performance.
Monitor each string's output separately (if your system provides this data). A single underperforming string often points to a specific failed panel or connection issue.
5. Battery Charge and Discharge Cycles
For systems with battery storage systems, monitor how your battery charges and discharges throughout the day. Under NEM 3.0, proper battery management directly impacts your savings.
Your battery should charge during peak solar production (10 AM-3 PM) and discharge during expensive evening hours (4-9 PM). If it's doing the opposite, your settings need adjustment.
6. Grid Export vs. Self-Consumption Ratio
With NEM 3.0's lower export rates, maximizing self-consumption becomes critical. Track how much solar power you're using directly versus sending back to the grid.
Your monitoring system should show instantaneous power flow. During the day, your solar should power your home first, charge batteries second, and only export excess third.
7. Actual Savings Validation
This is where most solar owners get stuck. Your system produces power, but are you actually saving money?
Compare solar to electric bills monthly. Calculate what you would have paid without solar (using your historical usage before installation) versus what you're paying now. The difference is your true savings.
Common Issues That Go Undetected for Months
Here are the problems that solar monitoring apps often miss entirely.
Gradual Inverter Degradation
Inverters don't always fail catastrophically. Sometimes they degrade slowly, operating at 80-85% efficiency instead of 95%+. Your system produces power, but less than it should.
This type of failure is nearly impossible to catch without comparing actual production to system design expectations. You're losing 15-20% of your potential generation, which adds up to thousands of dollars annually.
Partial Shading From Tree Growth
Trees grow. What provided full sun when you installed solar three years ago might now cast afternoon shadows across several panels.
Most solar owners don't notice this gradual change because they're comparing current performance to recent months—not to original system projections. The decline happens so slowly it feels normal.
Soiling and Debris Accumulation
Southern California's dry climate means dust, pollen, and bird droppings accumulate on panels faster than rain can wash them away. Production losses of 5-10% from soiling are common but rarely identified as the culprit.
If your system seems to produce more after rare rainstorms, soiling is likely reducing your year-round performance.
Utility Meter Issues
Sometimes the problem isn't your solar system—it's how your utility is crediting your production. Net metering errors, incorrect rate schedules, or meter malfunction can all make it appear your system isn't saving money when it's actually working fine.
If you notice your production numbers don't match your utility credits, this needs immediate investigation. Many solar owners discover billing errors months or even years later.
Microinverter Failures in Inaccessible Locations
When a single microinverter fails on a hard-to-reach roof section, some homeowners delay repairs due to access difficulty. Each failed microinverter typically costs you $100-200 per year in lost production.
For more details on why your system underperforming, check out our comprehensive troubleshooting guide.
How US Power Helps You Optimize System Performance
Whether we installed your system or not, US Power's CSLB-licensed consultants can help you understand what's happening with your solar panels.
Comprehensive System Evaluation
We don't just look at production numbers—we analyze your entire system against original design specifications, weather data, and expected degradation curves. This reveals issues that standard monitoring misses.
Our consultants review your monitoring data, utility bills, and system documentation to identify exactly where losses are occurring. In many cases, we can diagnose problems remotely through free solar consultation and data sharing.
Ongoing Performance Monitoring for Our Customers
US Power installation customers receive ongoing performance monitoring as part of our 25-year comprehensive warranty. We proactively identify and address issues before they impact your savings.
This includes quarterly production reviews, annual system health checks, and immediate alerts if your system shows unexpected performance changes.
When to Call for Professional Assessment
DIY monitoring works well for catching obvious problems, but some issues require professional diagnosis.
Call for an assessment if you notice: production drops exceeding 20% compared to expected output, frequent inverter error codes, inconsistent panel-level performance, or unexplained increases in your utility bills despite consistent solar production.
US Power serves all of Southern California including Los Angeles, Orange County, Ventura, San Bernardino, and Riverside. Our 3-6 week installation timeline means we can quickly replace failed components when necessary.
Taking Control of Your Solar System's Performance
The difference between a solar system that meets expectations and one that exceeds them often comes down to monitoring.
Start tracking the seven performance indicators outlined in this guide. Set reminders to review your data monthly. Document any anomalies and investigate them promptly.
Most importantly, don't assume your system is fine just because it's producing power. The question isn't whether it's working—it's whether it's working as well as it should be.
Protect Your Solar Investment With Proper Monitoring
Your solar system represents a significant investment in your home's future. Proper monitoring ensures you capture every kilowatt-hour of savings you're entitled to.
The solar owners who achieve the best returns aren't just the ones who install the most panels—they're the ones who actively monitor performance and address issues quickly.
Start implementing these monitoring practices today. Your utility bills will thank you.
Frequently Asked Questions
How often should I check my solar monitoring app?
What's the most important metric to track?
Can I monitor my system without an app?
How much production loss is normal over time?
What should I do if my monitoring shows an error code?
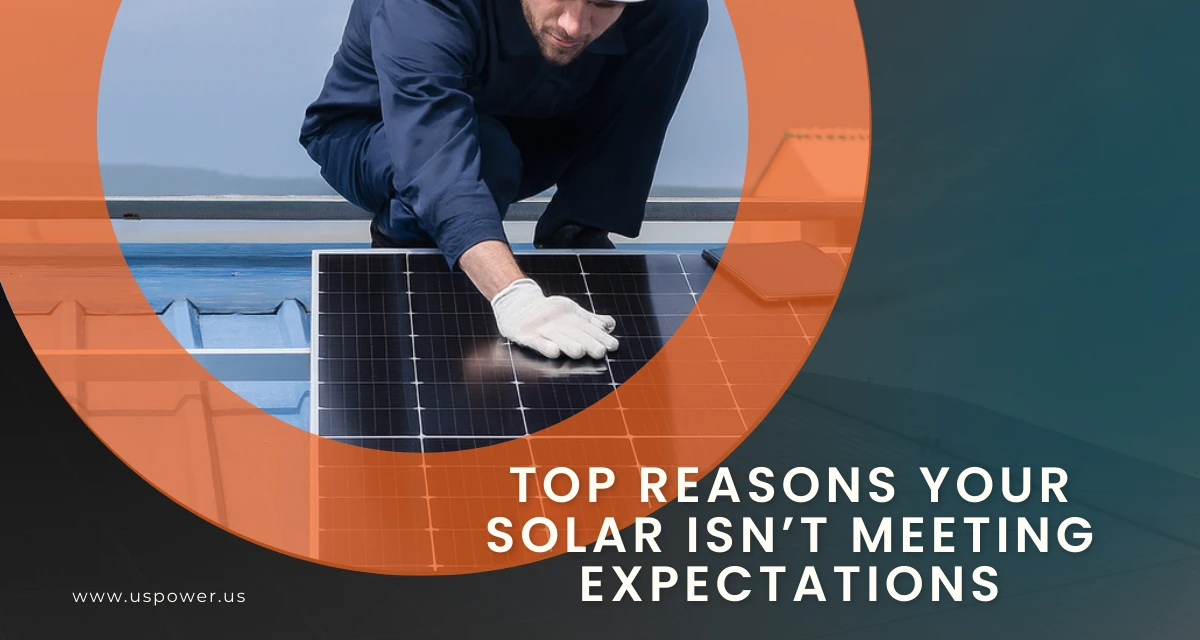
Top Reasons Your Solar Isn’t Meeting Expectations
Expert tips to maximize solar output in SoCal. Boost your solar efficiency with us.
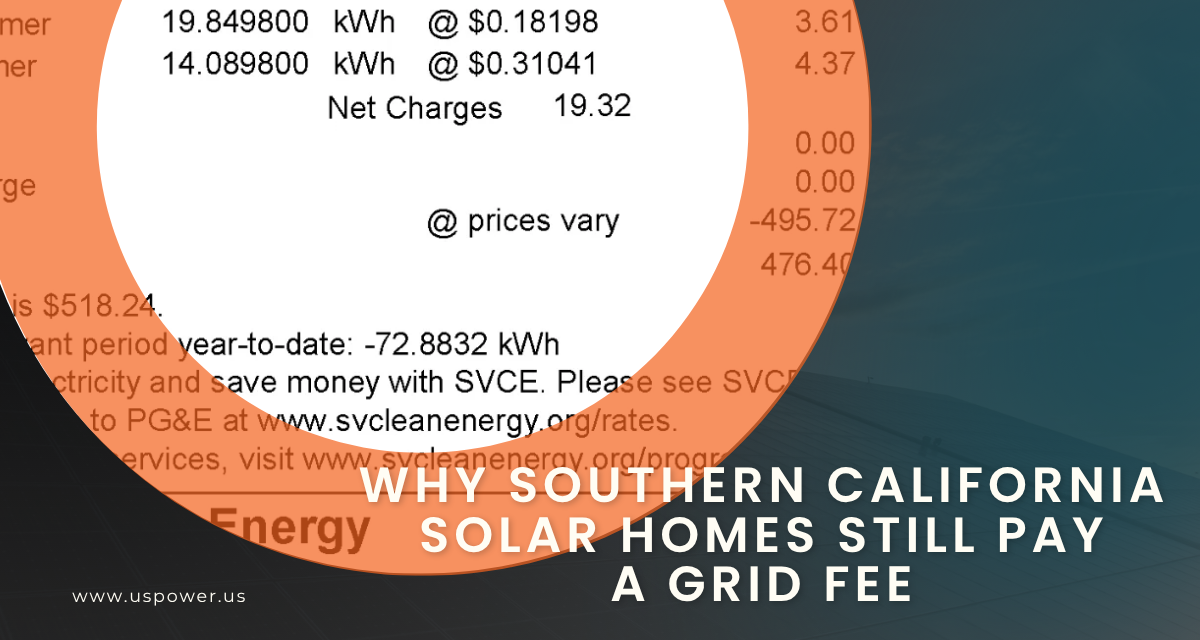
Why Southern California Solar Homes Still Pay a Grid Fee
Fixed monthly fees for SoCal solar homes explained clearly. Save more on solar!
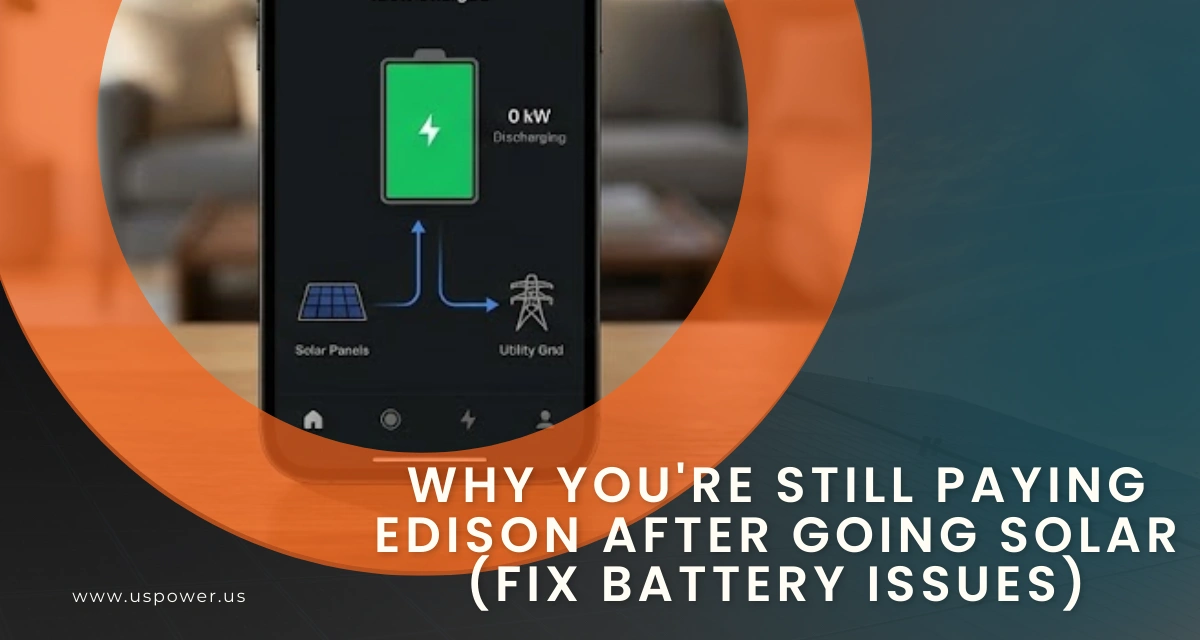
Why You're Still Paying Edison After Going Solar (Fix Battery Issues)
2 years of paying your solar loan AND Edison bills? That's $20,000+ down the drain.


Derechos de autor © 2025 US POWER | Energía solar y techosUS Power - Axia by QCells. All Rights Reserved.
¡Obtenga una estimación solar instantánea usando el satélite!