


Solar System Management: PTO, Monitoring & NEM 3.0 Explained

Don't lose export credits. Master solar system monitoring, understand PTO timelines for SCE/SDG&E/LADWP, optimize NEM 3.0 rates, and maximize SoCal savings now.
Your solar installation represents one of the most significant investments in your Southern California home. Yet most homeowners never take full control of their systems—leaving critical monitoring features disabled, missing out on export credits, and potentially losing thousands in savings.
The federal 30% tax credit expires for good. This means the efficiency of your installation matters more than ever.
This guide reveals exactly what you need to do after installation to maximize performance, understand your energy data, and manage your interconnection to SCE, SDG&E, or LADWP.
The Hidden Post-Installation Gap That Costs You Thousands
Most homeowners assume their system starts saving money immediately after installation. This is wrong.
Your system isn't truly "live" until it passes county inspection and receives Permission to Operate (PTO) from your utility. Until then:
- Your system generates power, but credits aren't officially tracked
- Your utility receives your solar energy without crediting you
- Many installers remain admin on your system account (they can access your energy data indefinitely)
Real-world example: A homeowner installed their system October 27, but didn't receive Enphase app access for several days. They discovered the installer had disabled consumption monitoring without explanation. When they requested activation, it took 24 hours. They didn't see their first complete day of data until two weeks after installation.
This gap costs homeowners thousands in missed optimization opportunities and lost credits.
Your Solar System Timeline: County Inspection → PTO → Earning Credits
Understanding your system's regulatory path is critical to maximizing returns.
Phase 1: County Inspection (1-4 weeks after installation)
Your local county must inspect your system before it legally operates.
What happens:
- Building inspector verifies installation matches approved plans
- Inspection checks building, electrical, and fire code compliance
- Inspector verifies proper wiring, disconnects, and safety equipment
- Inspection typically takes 30-60 minutes on-site
Southern California timelines:
- Orange County: 7-14 days after your inspection request
- Los Angeles County: 2-4 weeks (seasonal workload varies)
- San Diego County: 7-14 days typical
Your action: Schedule inspection immediately after installation is complete. Don't wait.
Phase 2: Permission to Operate (PTO) — When Credits Start
After passing inspection, your installer submits an interconnection application to your utility. This is when your system officially connects to the grid and export credits begin accumulating.
Utility processing times:
- SCE (Southern California Edison): 10 business days average
- SDG&E (San Diego Gas & Electric): 15-30 business days
- LADWP (LA Department of Water & Power): 20-45 business days (varies by interconnection type)
Critical insight: Before receiving PTO, your utility has zero obligation to track export credits. They may receive your free solar power without crediting you anything. Delays here directly impact your financial returns.
For a detailed breakdown of interconnection requirements, explore our guide to getting Permission to Operate (PTO) in Southern California.
Phase 3: System Live — Credits Begin Accumulating
Once you receive official PTO from your utility:
✅ Export credits begin accumulating on your account
✅ Consumption is formally tracked by your utility
✅ Export values are recorded for billing
✅ Your monthly billing cycle officially starts
✅ You're now a "prosumer" on the grid
Important: Don't assume your system is tracking credits just because it's generating power. Verify you've received official written PTO before assuming credits are accumulating.
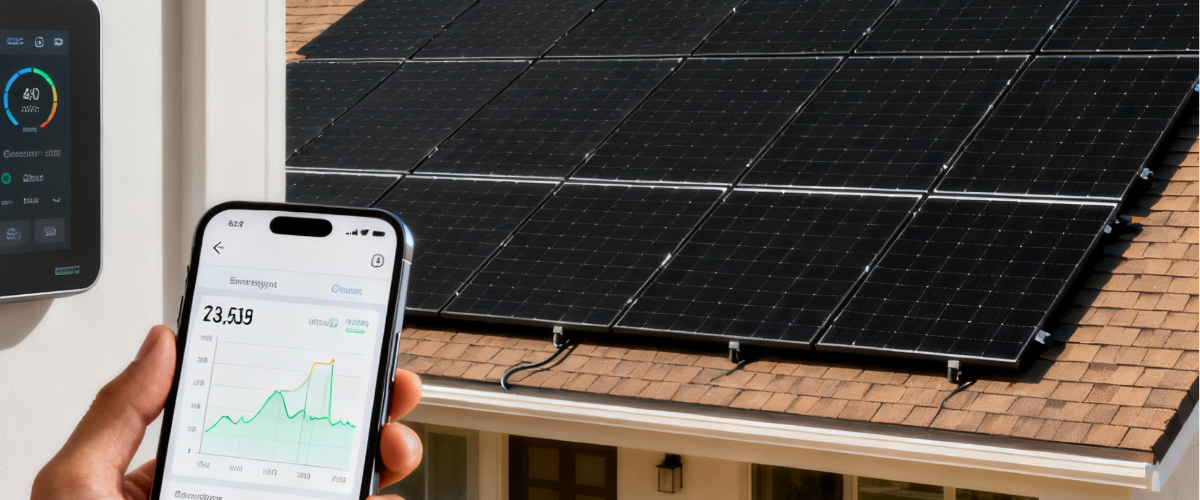
Enphase Monitoring Setup: Take Complete Control
If your system uses Enphase microinverters (common in high-efficiency QCells systems), the app is essential to understanding and optimizing your system.
Consumption Monitoring: The Critical Feature Most Installers Don't Enable
Consumption monitoring shows you exactly how much energy your home is using versus what your panels produce.
Why this matters:
- See exactly when high-draw appliances run (AC, pool pump, EV charger)
- Identify which devices use the most energy
- Understand your true export potential
- Optimize battery charging/discharge (if you have storage)
- Spot energy-wasting anomalies (phantom loads, continuous operation)
The problem: Many installers install Current Transformers (CTs) on your electrical panel but never enable the data stream in Enphase's cloud. The hardware is there—it's just not activated.
Enabling Consumption Monitoring (4 Simple Steps)
Step 1: Contact your installer's service department
- Request consumption monitoring activation
- They activate it remotely through Enphase's system
- Timeline: typically 24 hours
Step 2: Request full admin access to your account
- By law, you own your system—you should control your data
- You have the right to reset your Envoy gateway using the API key
- Take admin control immediately
Step 3: Verify your meter settings
- Choose "Total" setting (shows your complete home consumption)
- Avoid "Net" setting (only shows production difference)
Step 4: Download your first week of data
- Save baseline consumption patterns
- Establish your normal usage profile
Using the Enphase App: From Data to Action
The Enphase app displays everything you need:
Real-time data:
- kW produced right now
- kW your home is drawing right now
- kWh flowing to/from the grid
- Battery charge rates (if installed)
Historical insights:
- Daily production/consumption patterns
- Weekly and monthly trends
- Custom date ranges matching your utility billing cycle
- Financial impact dashboard
Pro tip: Match your app's date ranges to your utility billing cycle. Most SCE customers are on 28-31 day cycles. This lets you compare app data directly with your utility bill and verify correct credits.
Choose "Savings Mode" for Maximum Returns
The Enphase app offers three operational modes:
Recommendation: Choose Savings Mode immediately after setup. This AI-driven approach can increase your savings by 20-40% compared to basic modes. For advanced optimization strategies, learn more about how to maximize your solar savings with battery storage and smart monitoring.
Southern California NEM 3.0: How Export Credits Really Work
As of April 2023, Southern California switched from NEM 2.0 to Net Billing (NEM 3.0). This is the single most important change affecting your financial returns.
The Reality: Export Rates Dropped 73%
Under NEM 2.0 (ended 2023):
- Export rate: Full retail rate (~$0.25-$0.30/kWh)
- Result: Solar payback in 6-8 years
Under NEM 3.0 (current):
- Export rate: Wholesale rate (~$0.08/kWh average)
- Result: Lower immediate returns, BUT...
The Strategic Advantage: Time-of-Use Export Rates
Here's where NEM 3.0 becomes profitable: Your export value changes hourly based on grid demand.
Typical SCE/SDG&E export rates (November 2025):
- Midday (12-3 PM): $0.04-$0.08/kWh ⬇️ (low value)
- Morning (6-9 AM): $0.06-$0.12/kWh
- Evening Peak (6-9 PM summer): $0.25-$0.52/kWh ⬆️ (10x more valuable!)
- Late night (9 PM-6 AM): $0.02-$0.06/kWh (lowest)
Strategic insight: A single kWh exported at 8 PM is worth 10 times more than a kWh exported at noon.
Why Battery Storage Becomes Essential
Without battery storage, your system exports 97% of production during midday (low-value hours). With battery storage + AI optimization, you can:
- Use solar to power your home during the day
- Charge your battery with excess production
- Export battery power during evening peak ($0.30-$0.52/kWh)
- Potentially triple your export value
Translation: Battery storage + optimization = 20-40% higher returns.
Limited-Time Export Adder (Ends December 2027)
Systems interconnecting before December 31, 2027 receive a 9-year export rate bonus—higher export credits for nine years.
Action: If considering solar or battery storage, prioritize interconnection before end of 2027 to lock in this advantage.
Critical Pre-Inspection Checklist
Before scheduling your county inspection, verify:
Physical installation:
- ✅ Installation matches approved permit plans
- ✅ All wiring is labeled and accessible
- ✅ Electrical connections are secure
- ✅ All fasteners are tight and visible
- ✅ Conduit is properly secured and routed
Safety systems:
- ✅ Disconnects are installed and functional
- ✅ All disconnect switches are labeled
- ✅ Grounding is complete and inspectable
- ✅ Critter guard is installed
Why Critter Guards Matter
This protective mesh barrier prevents squirrels, raccoons, and birds from nesting under panels and chewing wiring.
The cost of skipping critter guards:
- Single animal damage incident: $2,000-$5,000 in repairs
- Production downtime while repairs happen
- Warranty complications
- Fire hazard risk
The cost of installing critter guards:
- Professional installation: $500-$1,500 (typical system)
- Timeline: Few hours before inspection
- ROI: Protects your entire 25-year investment
Recommendation: Install critter guards before inspection. It's non-negotiable in Southern California where wildlife is active year-round.
Post-Installation Management: Your 90-Day Action Plan
Week 1-2: System Setup
Critical actions:
- Request admin access to your Enphase account
- Verify consumption monitoring is enabled (demand activation if not)
- Confirm monitoring data flows to the app
- Save your first week of production/consumption data
Month 1: Establish Baselines
What to track:
- Daily production patterns against weather
- When does your AC run? How long?
- When are your lights on? Pool pump running?
- Compare actual production to installer projections (should be within 10%)
Action items:
- Monitor daily for anomalies
- Note high-draw appliances and their timing
- Verify your system performance baseline
Month 2-3: Optimize
Optimization steps:
- Set Enphase to "Savings Mode"
- Analyze when to run high-draw appliances
- Understand your time-of-use rate structure
- Plan for seasonal adjustments
Ongoing:
- Quarterly production reviews
- Compare utility credits to app data (5-10% variance is normal)
- Check for alerts or error messages
- Verify physical system integrity
Red Flags: When Something Isn't Right
🚩 Installer won't give you admin access
- You own your system—you control your data
- Demand credentials immediately
- If they refuse, escalate to management
🚩 Consumption monitoring installed but not enabled
- This is part of your system
- Demand immediate activation
- Track this in writing
🚩 Installer delays PTO submission
- Delays cost you credits
- Get written confirmation that application was submitted
- Get the application reference number
🚩 No official PTO 45+ days after inspection
- Contact your utility directly
- Call SCE, SDG&E, or LADWP and verify status
- Escalate if application is stuck
🚩 Monthly bills don't match Enphase data
- Small differences (5-10%) are normal
- Larger gaps suggest metering or billing errors
- Contact your utility to investigate
🚩 System produces 10%+ below projections
- Request professional evaluation
- May indicate installation, inverter, or shading issues
Seasonal Reality for Southern California
Your system's performance and value change dramatically throughout the year.
Summer (June-August): Peak Production, Peak Value
- Production: Maximum (3-4x winter levels)
- AC runtime: 12-15+ hours daily
- Export opportunity: Highest—evening peak rates reach $0.30-$0.52/kWh
- Strategy: Export during 6-9 PM peak hours for maximum credits
Spring (March-May): Building Opportunity
- Production: Moderate and increasing
- AC runtime: 2-8 hours as temps warm
- Export opportunity: Good—rates rising as season progresses
- Strategy: Start building export credits early
Fall (September-November): Declining Returns
- Production: Decreasing
- AC runtime: Declining as weather cools
- Export opportunity: Moderate
- Strategy: Use summer credits to offset fall usage
Winter (December-February): Lowest Returns
- Production: Lowest (60-70% below summer)
- AC runtime: Minimal (heating not needed in SoCal)
- Export opportunity: Low
- Strategy: Rely on summer credits to offset winter bills
The December 31, 2025 Tax Credit Deadline
This is urgent and non-negotiable.
The federal 30% Residential Clean Energy Credit (Section 25D) expires December 31, 2025 with no extension.
Starting January 1, 2026:
- 2026: Credit drops to 26%
- 2027: Credit drops to 22%
- 2028+: Credit expires completely
To qualify for 30% credit:
- System must be installed
- System must be operational (not under construction)
- System must pass county inspection
- Ideally, you've received PTO
The financial impact:
- $30,000 system installed by Dec 31, 2025 = $9,000 credit
- Same system installed Jan 1, 2026 = $7,800 credit
- Difference: $1,200 on a single system
For Southern California, this means starting your process now. County inspection queues explode in Q4. If you want the full 30% credit, your installation should be complete by mid-November to allow time for inspection and PTO processing.
Ready to Optimize Your Southern California Solar System?
Your solar investment represents 20-25 years of potential savings. For a typical Southern California home, that's $15,000-$25,000 in total value. The three hours you invest in proper setup and monthly monitoring determines whether you earn $15,000 or $25,000. That's a $10,000 difference for three hours of work. Most homeowners leave this money on the table simply by not taking control after installation.
Take action this week:
- Request admin access
- Enable consumption monitoring
- Verify your interconnection timeline
- Optimize for NEM 3.0 rates
- Install critter guards
Your solar system shouldn't be a mystery. Master the data. Master the savings.
High-efficiency QCells solar panels paired with comprehensive Enphase monitoring deliver superior performance for Southern California homes.
Our factory-direct partnership with QCells means:
- Transparent pricing
- American-made quality
- Expert installation and support
- Comprehensive post-installation optimization
Schedule your consultation today to discuss system setup, monitoring optimization, and personalized strategies for your specific Southern California location and utility provider.
Let's make sure your solar investment delivers maximum returns.
Frequently Asked Questions

Which Backup Power Option Is Right for You?
Explore backup power solutions to keep your home running during power outages.

Solar Panels on the Wrong Side of Your Roof? Here's What to Do
Expert guide for Southern California homeowners on solar panel orientation & NEM 3.0.
Understanding PG&E PTO & Power Control Systems for SoCal
Get PTO approval faster and save with a PCS-certified system through US Power.


Copyright © 2025 US Power - Axia by QCells. All Rights Reserved.
Get an instant solar estimate using satellite!