


Can Your Solar System Beat 55 kWh Daily? Real CA Numbers 2026

Is your 8kW system producing 55+ kWh daily? Real California homeowners share production numbers that reveal which systems truly perform—and which fall short.
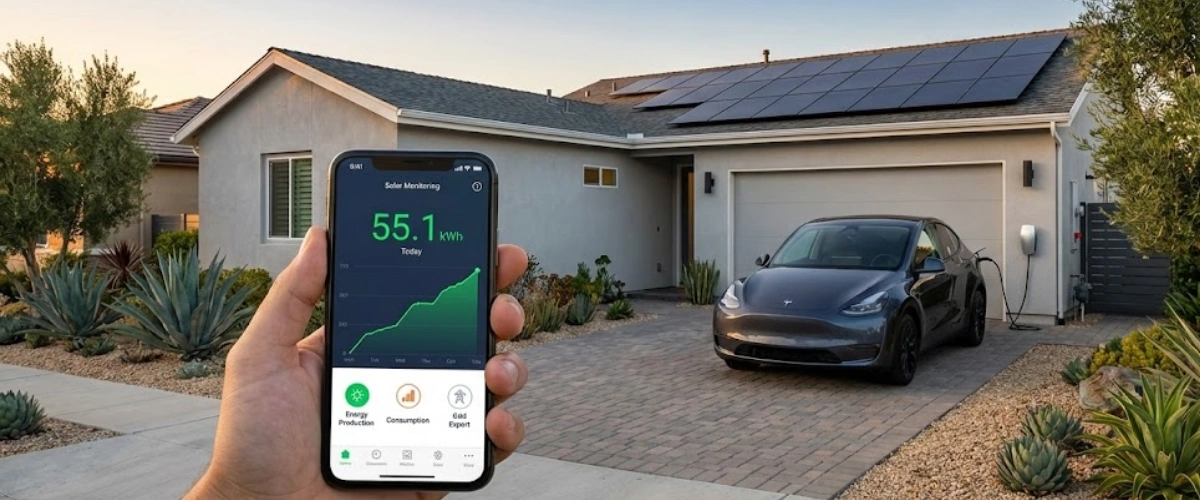
A homeowner in the SF Bay Area recently shared something that stopped other solar owners in their tracks: their 8kW system produced 55.1 kWh in a single day. The production efficiency ratio? A remarkable 6.9 hours of equivalent full-sun performance. Within hours, dozens of California homeowners jumped into the conversation, comparing their own numbers and asking the same question: "Is my system underperforming?"
If you've ever wondered whether your solar panels are actually living up to their potential, you're not alone. Let's break down what these real-world production numbers mean for your system—and your savings.
Why Production Efficiency Matters More Than System Size
You might think an 8kW system is just an 8kW system. But the numbers tell a different story.
The kWh-per-kW Ratio Explained
The most revealing metric isn't your total daily production—it's your production efficiency ratio. This simple calculation tells you how many hours of equivalent peak sun your system captures:
Daily kWh ÷ System kW = Efficiency Hours
That Bay Area homeowner's 55.1 kWh ÷ 8kW = 6.9 hours. Another Southern California homeowner with a 10.8kW system reported 78.6 kWh, which equals 7.29 hours—even better efficiency. A third homeowner with a 7.98kW system in SoCal hit 55.7 kWh (6.98 hours) before their panels got "filthy" and production dropped.
What "Good" Production Actually Looks Like in 2026
Based on real homeowner data from across California:
Excellent: 7+ efficiency hours (typically requires optimal conditions—cool temps, high altitude, perfect orientation)
Very Good: 6.5-7 hours (what most well-designed systems achieve in peak season)
Good: 6-6.5 hours (solid performance for typical installations)
Concerning: Below 6 hours (may indicate shading, poor orientation, installation issues, or equipment problems)
One homeowner in the thread mentioned they switched from IQ7+ inverters and only hit 43 kWh on the same day others were seeing 55+ kWh. The difference? Clipping losses and potentially suboptimal equipment pairing.
Real California Solar Performance Data: Bay Area vs. Southern California
Here's where things get interesting. You'd expect Southern California's endless sunshine to dominate, right? The real-world data reveals something more nuanced.
Temperature's Hidden Impact on Your Panels
That SF Bay Area homeowner mentioned something critical: they live "at high altitude above the usual cloud line" where temperatures stayed between 54-73°F on their record production day. Meanwhile, homeowners in Houston reported running HVAC 238 hours in June alone, with temperatures over 100°F for days.
Solar panels lose approximately 0.5% efficiency for every degree above 77°F. On a scorching 105°F day in the Inland Empire, your panels could be operating at 86% of their rated capacity. That same system at 65°F in the Bay Area hills? Running at 106% capacity.
This explains why a SoCal homeowner saw their 7.98kW system drop from 55.7 kWh to lower numbers once "it's been a little warmer." Temperature isn't just a minor variable—it's often the difference between excellent and mediocre production.
Why a SoCal System Might Outperform Despite Higher Heat
Don't count out Southern California yet. One Thousand Oaks homeowner with a 10.8kW system hit 78.6 kWh in July—a stunning 7.29-hour efficiency ratio. Their advantage? Longer daylight hours in summer (about 14.5 hours vs. 14 hours farther north) and fewer marine layer interruptions compared to coastal areas.
The takeaway: Location matters, but it's not just about latitude. Microclimates, altitude, and seasonal weather patterns can make a bigger difference than being 100 miles north or south.
Altitude and Cloud Line Advantages
Several Bay Area homeowners in the thread specifically mentioned altitude as their secret weapon. Living above the fog line means:
- Clearer air with less particulate matter blocking sunlight
- Cooler ambient temperatures keeping panels efficient
- Fewer cloudy mornings eating into production hours
- More consistent performance year-round
One homeowner reported their south-facing panels actually produced less than their northwest-facing panels due to altitude and positioning. Traditional wisdom says "face south," but real-world conditions sometimes override the textbook answer.
How to Calculate Your System's True Efficiency
Ready to benchmark your own system? Here's the simple process California homeowners are using.
The Simple Formula Homeowners Use
- Find your best production day in your monitoring app (look for a clear, cool spring day)
- Divide daily kWh by your system's DC kW rating (the number on your permit, not AC inverter capacity)
- Compare to the benchmarks listed earlier
Example: You have an 8kW system that produced 48 kWh yesterday.48 ÷ 8 = 6.0 hours efficiency
That's solid, but if multiple neighbors with similar systems are consistently hitting 6.5-7 hours, you might want to investigate further. Common installation problems that reduce production can dramatically impact these numbers.
Benchmarking Against Your Neighbors (When to Worry)
In the Reddit thread, one homeowner asked if anyone could "beat" their 55.1 kWh production. Within hours, several people posted higher numbers—but here's what matters: Were they comparing apples to apples?
A 12kW system producing 69 kWh sounds impressive, but that's only 5.75 efficiency hours—actually worse than the original 8kW system. Always convert to the efficiency ratio before comparing.
Red flags that suggest investigating your system:
- Your efficiency hours are consistently 1+ hour below similar systems in your area
- Production dropped suddenly and hasn't recovered (could indicate equipment failure)
- You're seeing 5 hours or less during peak summer months
- Your system has visible damage, loose connections, or error messages
The Bay Area homeowner in the thread mentioned they "had some trouble initially with production drop that was fixed by changing out a faulty breaker and tightening terminal connections." That single fix likely added thousands of dollars in lifetime production value.
What Makes QCells + Enphase IQ8 Systems So Efficient?
The original thread highlighted QCells 400W panels with Enphase IQ8M microinverters. There's a reason this combination keeps appearing in high-performance discussions.
Why Factory-Direct QCells Panels Cost Less But Perform Better
QCells panels consistently appear in top-production discussions for three reasons: quality control, manufacturing precision, and real-world durability. As an exclusive QCells partner, US Power delivers these American-made panels at factory-direct pricing—typically 15-20% below what other installers charge for comparable equipment.
But price isn't the story here. The thread shows QCells panels maintaining efficiency even in less-than-perfect conditions. One homeowner reported "quite a bit" of tree shade but still achieved strong production with their 12.48kW QCells system. That's why QCells panels perform consistently well compared to budget alternatives that crater in partial shade.
IQ8M vs. IQ8+ vs. IQ8A: Which Prevents Clipping?
Here's where the thread gets technical—and interesting. Multiple homeowners mentioned different Enphase IQ8 models:
IQ8M (280W): Best for 350-440W panels, minimal clippingIQ8+ (300W): Handles up to 460W panels but may clip on high-production days
IQ8A (366W): Maximum output for larger panels, never clips
One homeowner with IQ8A inverters specifically commented "never clips!" while others with IQ7+ mentioned lower production. The original poster's IQ8M inverters perfectly matched their QCells 400W panels—avoiding the clipping losses that cost homeowners thousands over 25 years.
Choosing the right Enphase microinverter isn't just a technical detail—it's the difference between 6.0 and 6.9 efficiency hours.
The Installation Quality Factor (Breakers, Connections, Wiring)
Remember that Bay Area homeowner who fixed their production drop by replacing a faulty breaker and tightening terminals? That's not rare. Poor installation quality is the silent killer of solar production efficiency.
Common installation issues that reduce production:
- Undersized or faulty breakers limiting current flow
- Loose terminal connections creating resistance
- Incorrect conduit routing causing heat buildup
- Improper panel spacing reducing airflow and cooling
- Missing or incorrectly installed grounding
US Power's CSLB-licensed installers follow strict quality protocols, with every connection torqued to manufacturer specs and triple-checked before activation. Our 25-year workmanship warranty isn't just paperwork—it's backed by installation practices that prevent the problems other companies create.
Optimizing Your System for Maximum Daily Production
The thread's original poster did something clever: they manually adjusted their EV charging rate throughout the day to match solar production exactly. While that's dedication, there are smarter ways to optimize.
EV Charging Strategies That Match Solar Output
The Bay Area homeowner admitted their system was "a little bit undersized for two EVs but oversized for one." Sound familiar? This is the challenge facing thousands of California households adding a second EV.
Instead of manually babysitting charge rates, modern solutions exist:
Smart EV chargers like Emporia can automatically adjust charging current based on real-time solar production. One commenter in the thread explained they adjust from 6-48 amps in 1-amp increments through an app—no manual intervention needed.
Tesla's latest update includes a "charge from solar only" feature that zeros out grid export automatically. You're using every electron your panels make, exactly when they make it.
For homeowners serious about maximizing solar-powered EV charging, the math is straightforward: how to size your system for EV charging depends on your daily driving miles, vehicle efficiency, and whether you charge one or two vehicles.
When "Undersized" Systems Actually Make Financial Sense
Here's a counterintuitive truth from the thread: The original poster said "the most amount of value of a solar system in PGE area is one where you use up all the energy and then some."
Under NEM 3.0, export credits are worth roughly 75% less than they were under NEM 2.0. This completely changes the sizing equation. A system that produces exactly what you consume (including EV charging) often delivers better ROI than an oversized system that exports heavily.
The Bay Area homeowner had 160% offset—meaning their annual production covered 160% of their annual consumption. Perfect under old rules, potentially suboptimal under NEM 3.0 which makes self-consumption essential.
NEM 3.0 Reality: Why Self-Consumption Beats Export
Multiple homeowners in the thread mentioned they're adjusting consumption to match production curves. This isn't just hobby-level optimization—it's the new economic reality.
Under NEM 3.0, you want to:
- Shift heavy loads (laundry, dishwasher, pool pumps) to daytime
- Charge EVs during solar production hours when possible
- Run HVAC pre-cooling cycles using solar before peak hours
- Store excess in batteries rather than exporting to grid
One commenter suggested the original poster would be "the best candidate for NEM 3.0, consuming everything you produce in the moment." They were exactly right. How temperature affects your solar panels matters, but how you use that production matters even more now.
Getting Started with US Power
The California homeowners in that Reddit thread are comparing notes for a reason: they want to know if they made the right choice. If you're reading this wondering whether your system measures up—or whether you should finally pull the trigger on solar—the answer is clearer than you think.
US Power delivers what the top-performing systems have in common: American-made QCells panels that maintain efficiency in real-world conditions, properly sized Enphase IQ8 microinverters that never clip, and installation quality that prevents the breaker and wiring issues that kill production.
Our factory-direct partnership means you get premium equipment at prices other companies can't match. Our CSLB-licensed consultants size systems based on your actual usage patterns—including EV charging, pool equipment, and future electrical loads. And our 25-year comprehensive warranty (panels, workmanship, and performance) means you're protected even if something goes wrong.
Southern California homeowners are hitting 6.5-7+ efficiency hours with properly designed systems. The question isn't whether solar works—it's whether your solar will work as well as it should.
Get your free consultation and production analysis today. We'll show you exactly what your roof can produce, what it should cost, and how quickly you'll break even with rising SCE and PG&E rates.
Ready to beat 55 kWh daily? Let's find out what your roof can do.
Frequently Asked Questions
What's a realistic production number for an 8kW system in Southern California?
How much does heat reduce solar panel efficiency?
Are QCells panels better than SunPower or REC?
Should I size my system for one EV or two?
How do I know if my system has wiring issues affecting production?

The 30% Solar Tax Credit Ends in 55 Days — What Homeowners Must Do Now
Just 55 days left! Don’t lose your 30% solar savings — book before mid-November!

Is Vehicle-to-Grid Power Finally Here?
Discover how V2G works and why it’s shaping California’s clean energy future.

New Solar Law: California SB 283 Battery Safety Law 2025
Keep your home safe with certified Qcells solar and battery systems through US Power.


Copyright © 2025 US Power - Axia by QCells. All Rights Reserved.
Get an instant solar estimate using satellite!