


Why Doesn't My Solar Monitoring Match My Utility Bill?

Confused why your solar app shows different numbers than your SCE bill? Learn why monitoring and utility readings differ and how to read both correctly.
You check your Tesla or Enphase app. It says you produced 615 kWh of solar energy last month and pulled 751 kWh from the grid. Great, right?
Then you open your SCE bill. It shows just 172 kWh of usage. Wait—what? Those numbers don't match at all. Did your solar system malfunction? Is SCE charging you incorrectly? Should you be worried?
This exact scenario played out for a Southern California homeowner recently, and it's more common than you think. The confusion stems from a simple fact: your solar monitoring system and your utility meter are measuring completely different things.
Let's clear up the confusion once and for all.
Understanding What Your Utility Actually Measures
Here's the fundamental truth many solar companies don't clearly explain: your utility company has no idea how much electricity you actually consume.
SCE, PG&E, and other California utilities only track net grid transactions—the electricity that flows to and from the grid through your meter. They cannot see what happens inside your home.
Your Utility Meter Only Sees Grid Activity
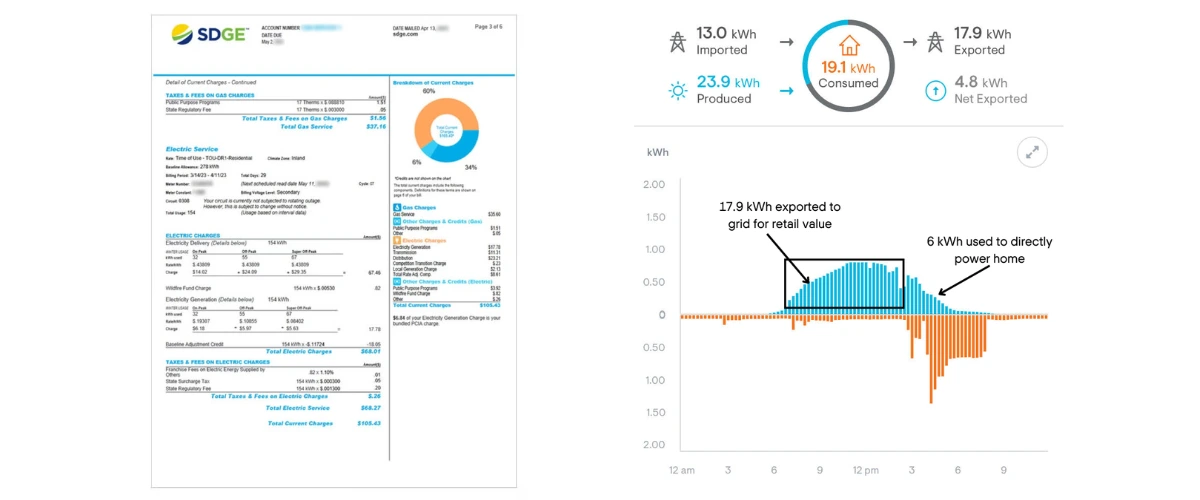
When you produce 500 kWh of solar energy in a month but consume 400 kWh during daylight hours, your utility meter only registers the excess 100 kWh you exported to the grid. Those 400 kWh you self-consumed? Invisible to SCE.
This is why your utility bill shows dramatically lower numbers than your solar monitoring app. Your app tracks total home consumption. Your utility tracks net grid exchanges.
Bidirectional Meters Track Two Separate Flows
Modern solar installations use bidirectional meters that track energy flowing in both directions:
- From Grid (import): When you pull power at night or on cloudy days
- To Grid (export): When your panels produce more than you're using
Your utility bill typically shows the net difference between these flows. Under NEM 2.0, exports offset imports on a 1:1 basis. Under NEM 3.0, it's more complex—export credits are worth 75% less than the cost of imported power, making self-consumption crucial.
Here's a detailed guide on How to Read Your SCE Bill with Solar.
Why Your Numbers Never Quite Match
Even when you align billing periods perfectly, you might notice a 5-10% discrepancy. This is normal and usually caused by:
- Measurement timing differences: Solar monitoring updates in real-time; utility meters average over 15-minute intervals
- CT clamp accuracy: Most solar monitors use current transformers with ±1-2% tolerance
- Meter calibration: Utility revenue meters are calibrated differently than monitoring equipment
- Phantom loads: Small draws your monitoring might miss (like LED standby lights)
If your discrepancy exceeds 15%, that's worth investigating. But 10% or less? That's just how the technology works.
Why Southern California Homeowners Get Confused
The confusion is especially common in Southern California because of rising electricity bills and changing solar policies.
NEM 3.0 Changed the Game
Before NEM 3.0 (April 2023), most homeowners didn't pay close attention to self-consumption. As long as you generated enough solar to offset your annual usage, you were fine.
Under NEM 3.0, the economics flipped entirely. Export credits are now worth roughly $0.05-0.08 per kWh, while imported grid power costs $0.35-0.55 per kWh depending on your SCE rate plan and time of use.
This means self-consumption is now 4-7 times more valuable than exports. Suddenly, understanding exactly how much you're consuming vs. exporting matters enormously.
That's why solar batteries can maximize your savings under the new rules.
Billing Cycles Don't Align
Another common source of confusion: your solar monitoring typically reports by calendar month (January 1-31), while SCE bills often run on cycles like the 10th to the 10th of each month.
To properly compare numbers, you need to time-shift your solar monitoring data to match your utility billing period. Most apps let you export daily data and recalculate totals for custom date ranges.
Could You Have an "Energy Vampire" in Your Home?
Many homeowners panic when they see increased consumption, assuming something is secretly draining power. While this occasionally happens, it's rarely a dramatic "energy vampire."
Common Culprits Behind Rising Consumption
If your monitoring shows significantly higher consumption than previous years, check these usual suspects first:
Lifestyle Changes
- Kids getting older and using more devices (gaming consoles, computers, phones charging)
- Working from home more frequently
- Running HVAC longer as California temperatures climb
- New appliances (second fridge, electric vehicle, hot tub)
Equipment Additions
- Sump pumps running more due to increased groundwater
- Pool equipment operating longer cycles
- New EV charging at home
- Smart home devices that draw power 24/7
Check out our guide to the Top 6 Appliances that Use the Most Electricity at Home to identify potential culprits.
When to Actually Worry
Real energy vampires do exist, but they're usually obvious once you know what to look for:
- Failing HVAC systems: A struggling AC unit can double your electricity consumption
- Water heater malfunctions: A broken thermostat can leave the element running constantly
- Well pump issues: A stuck relay can run the pump non-stop
- Grow operation next door: Believe it or not, wiring errors have connected neighbors' circuits
If your consumption jumped 50%+ overnight with no lifestyle changes, call an electrician. But if it crept up 15-20% over several years as your family grew? That's normal.
Why Proper Solar Monitoring Matters in 2025
Accurate monitoring isn't just about satisfying your curiosity—it directly impacts your savings, especially under NEM 3.0's self-consumption requirements.
Track Self-Consumption in Real-Time
The best solar monitoring systems show you exactly when you're using solar power vs. grid power. This lets you shift high-energy activities (running the dishwasher, charging your EV, doing laundry) to solar production hours.
A homeowner who blindly runs appliances anytime might self-consume 40% of their solar production. A homeowner who actively monitors and shifts loads can hit 70%+ self-consumption—nearly doubling their savings under NEM 3.0.
Learn more strategies to boost solar savings with smart monitoring.
Identify System Issues Early
Good monitoring also alerts you to performance problems before they crater your savings:
- Inverter failures: Production drops to zero
- Panel shading: New tree growth or construction reducing output
- Soiling losses: Dust and debris cutting production 5-10%
- Utility interconnection problems: System disconnected without your knowledge
US Power's QCells monitoring sends immediate alerts if production drops unexpectedly, so you're never left wondering why your bill spiked.
Prove Your Savings for Refinancing or Resale
When you sell your home or refinance, documented solar savings increase your property value. Clear monitoring data showing consistent 70%+ utility bill reductions makes your system far more attractive to buyers or appraisers than vague claims.
How US Power's Monitoring Eliminates Confusion
At US Power, we've seen hundreds of homeowners struggle with monitoring confusion from other installers. That's why we built our approach around transparency and clarity.
QCells Integrated Monitoring
Our exclusive partnership with QCells means every system includes integrated monitoring that tracks:
- Solar production by panel (identify underperforming panels instantly)
- Home consumption broken down by time of day
- Grid imports and exports with cost calculations under your specific rate plan
- Battery charge/discharge cycles if you add storage
- Historical trends to spot anomalies early
Learn more about the QCells Monitoring System and integrated technology.
We Teach You to Read Both Systems
During your installation, our CSLB-licensed team walks you through:
- How to interpret your monitoring dashboard
- How to read your SCE or PG&E bill with solar
- How to compare the two data sources correctly
- When discrepancies are normal vs. concerning
- How to maximize self-consumption for NEM 3.0 savings
We don't just install and disappear—we ensure you understand exactly what you're seeing.
2-3 Week Installation Timeline
Unlike national installers that take 4-6 months, US Power completes most installations in just 2-3 weeks after permit approval. This means you're generating savings (and getting accurate monitoring data) months earlier.
With the 30% federal tax credit expiring December 31, 2025, fast installation matters more than ever.
What to Ask Your Solar Company About Monitoring
Before signing with any solar installer, ask these critical questions about monitoring:
Equipment Questions
- "What monitoring system is included, and is it free or an add-on?"
- "Can I see production, consumption, and grid activity separately?"
- "Does the app work on both iOS and Android?"
- "How often does data update—real-time, every 15 minutes, or daily?"
Support Questions
- "Do you teach me how to interpret the monitoring data?"
- "Who do I contact if I see unexpected readings?"
- "Is monitoring support included in my warranty?"
- "Can you access my monitoring data to troubleshoot remotely?"
Billing Alignment Questions
- "How do I compare monitoring data to my utility bill?"
- "Does your monitoring show estimated savings under my specific SCE rate plan?"
- "Can I export data to align with my utility billing cycle?"
For a comprehensive pre-solar checklist, see our guide on Things You Must Know Before Going Solar in California.
If your installer can't answer these questions clearly, that's a red flag. Good solar companies ensure you understand your system completely.
Getting Started with US Power
Understanding your solar monitoring shouldn't require a PhD in electrical engineering. At US Power, we believe transparency starts with clear communication.
When you choose US Power and QCells, you get:
- Factory-direct pricing (15-20% below retail rates)
- American-made panels from QCells' Dalton, Georgia facility
- CSLB-licensed installers (not subcontractors)
- 25-year comprehensive warranty (panels, workmanship, and performance)
- 2-3 week installation timeline (from permit approval to activation)
- Integrated monitoring that shows exactly what you need to know
- 165+ five-star Google reviews from real Southern California homeowners
The 30% federal tax credit expires December 31, 2025. After that, the credit drops to 26% for 2026 only, then disappears entirely. With our fast installation timeline, you can lock in maximum savings before the deadline—even if you start your consultation today.
Don't miss out—the Federal Solar Tax Credit Expires December 31, 2025.
Frequently Asked Questions
Why does my solar app show I used more power than my SCE bill?
Should my "From Grid" number match my utility bill?
How do I know if my solar system is broken or just normal variation?
What's the normal discrepancy percentage between monitoring and utility bills?
Will my monitoring system alert me to problems automatically?

Federal Solar Tax Credit: Your Final Call for 30% Savings
Your last chance to claim the full 30% federal solar tax credit. Claim savings now!
Solar System Management: PTO, Monitoring & NEM 3.0 Explained
Before receiving PTO, your utility has no obligation to track export credits or pay y

Last Chance for 30% Solar Savings: Tax Credit Deadline 2025
Secure your solar system by Dec 31, 2025, to lock in the full 30% tax credit.


Copyright © 2025 US Power - Axia by QCells. All Rights Reserved.
Get an instant solar estimate using satellite!